
Uptime green, orders zero: catching a WooCommerce store that stopped selling
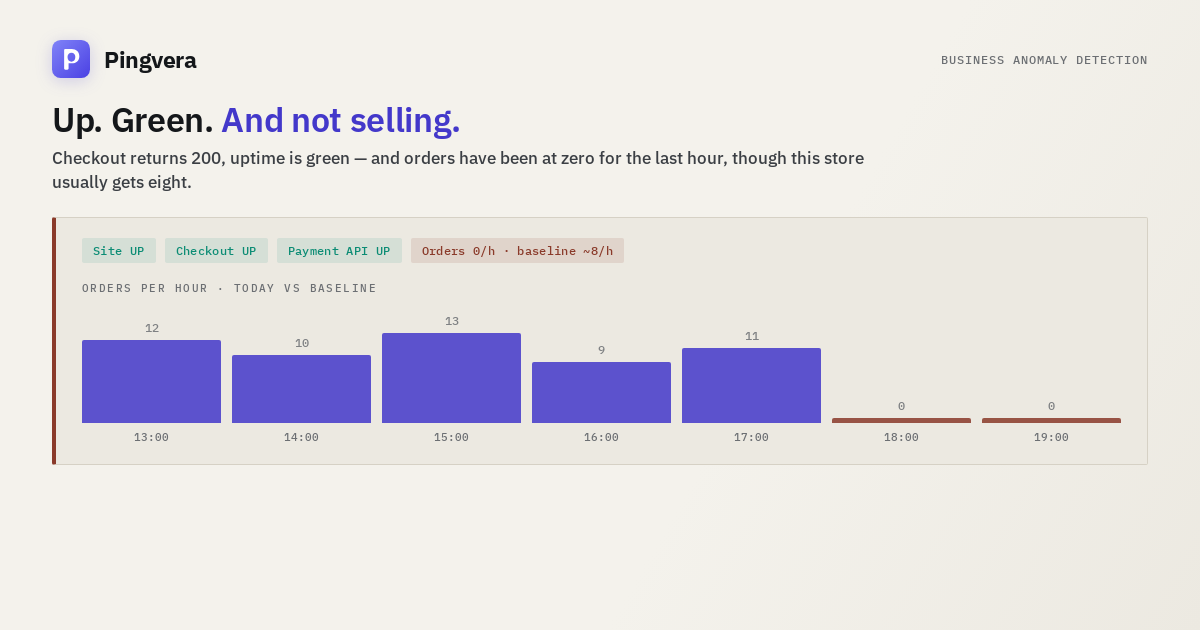
The uptime monitor has been green all day. The status page shows 100%. Checkout loads, the cart adds up, the "Place order" button is right there. And the store has not sold anything in an hour, when it usually sells eight or nine orders in that window. Nothing in the classic monitoring stack will tell you that — because nothing in the classic monitoring stack is looking at orders. It's looking at pages loading. This is the gap, and it's exactly the gap real-time order events and an hourly baseline are built to close.
The question uptime monitoring actually answers
An uptime check does one thing, and it does it well: it requests a URL on a schedule and records whether the response came back and how fast. That answers "is the server reachable and responding correctly." It is a genuinely necessary check — a store that returns 500 or times out is obviously broken, and you want to know in seconds.
But "the server responded" and "the business is working" are different claims, and the gap between them is where a store quietly stops selling while every dashboard stays green. A handful of concrete ways a checkout keeps returning 200 while it stops converting:
- The payment gateway is left in test mode. The checkout page renders identically. Card fields accept input. The order attempt fails or silently routes to a sandbox — nothing about that changes what an uptime probe sees.
- A plugin or theme update breaks the checkout template. The page still loads with a 200. The "place order" button might be misplaced, disabled by a JS error, or simply not wired to the form submit anymore.
- A webhook that confirms payment stops firing. The HTTP response for the checkout page itself never touches this at all — it's a background call between the payment processor and the store that an outside HTTP probe was never watching in the first place.
- The order-creation pipeline breaks on the server. A conflicting plugin, a database error, a misconfigured order-status hook — the storefront renders fine because it's a completely separate code path from the one that actually writes the order.
- Orders simply stop — no error anywhere, just nobody completing a purchase, which can be the checkout, the payment method, or something upstream like a broken ad campaign or an expired discount code loop. Whatever the cause, "nothing is happening" produces no error for anything to catch.
Every single one of these leaves the HTTP status code at 200. That is the blind spot, and it is not a small one: it is every failure that happens after the page has already loaded correctly.
Why polling can't see a business that stopped, even if you poll the right thing
You could imagine solving this by polling something order-related — hitting a "how many orders today" endpoint every five minutes. It would still be the wrong shape of tool, for two reasons.
First, polling has no memory of what's normal. A number by itself — "orders today: 14" — means nothing without knowing whether 14 by 3pm is a catastrophe or a great day for this particular store. Second, and more fundamentally, absence is not an event. An uptime check fails loudly: a timeout, a 500, a TLS handshake error — something happens that the monitor can catch. A store that stops selling produces no such moment. Nothing errors. Nothing times out. The silence just accumulates, one non-event at a time, and a system built to catch events has nothing to catch.
That's why Pingvera's WordPress/WooCommerce connector doesn't poll for orders — it reports them. The plugin sends an order.created event to the dashboard at the moment a checkout completes, with the order id, amount and currency (no customer personal data), plus order.failed when a payment attempt is declined. That turns "did anything happen" from a question you have to keep asking into a stream you can watch stop.
Watching a stream stop: the hourly baseline
A stream that stops is still not useful on its own — you need to know whether stopping is normal. A boutique selling three items a week has hours with zero orders as a matter of course; alerting on that would just be noise nobody trusts, and noisy alerts get muted, which defeats the entire point.
So the detector builds a baseline: for each store, it learns the normal order count by day of week and hour of day, from eight weeks of that store's own history. Tuesday at 2pm is compared against other Tuesdays at 2pm. A Saturday-heavy store is compared against its own Saturdays, not a flat average that would falsely flag its quiet Mondays every single week.
The condition that raises an incident is deliberately narrow:
- the baseline for this store, this day of week, this hour, is at least 3 expected orders — so a slow store that rarely sells in a given hour never triggers a false alarm;
- the actual order count in the last hour is zero;
- the silence has held for 60 minutes — long enough to rule out an ordinary lull, short enough that you find out the same afternoon, not three days later.
And critically, this incident only makes sense — only means anything actionable — when it fires alongside a green uptime check and a checkout that's returning 200. That combination is the signal: the site works, and the business isn't. If uptime were also red, you wouldn't need a baseline to tell you something's wrong.
Uptime monitoring vs business observability
| Question | Uptime / checkout monitoring | Business anomaly detection |
|---|---|---|
| Did the server respond? | Yes — this is exactly what it's for | Not its job |
| Is the checkout page rendering? | Yes, with a synthetic page-load check | Not its job |
| Is the payment gateway in test mode? | No visibility | Checked directly against the live config |
| Did a webhook silently stop firing? | Invisible — never touches the HTTP response | Shows up as orders stuck or a drought |
| Are real customers completing real purchases? | No visibility — that's not a page load | Yes — measured directly from order events |
| How do you know something's wrong? | An explicit failure: timeout, 500, TLS error | An absence: orders that should have happened and didn't |
| Time to notice a dead checkout with a 200 status | Never, by design — nothing failed | Within the hour, against the store's own baseline |
Neither column replaces the other. A store with only the left column can be losing every sale for a day and show a perfect uptime report. A store with only the right column has no idea if the server itself fell over. You want both watching, because each is structurally blind to what the other one exists to catch.
Why silence is worse than an error, not just harder to catch
It's tempting to think of "no orders" as a milder problem than "site down" because nothing is technically broken. In practice it's often worse, for a reason that has nothing to do with detection difficulty: WooCommerce's own notification system depends on orders existing. Order-confirmation emails, admin new-order notifications, anything triggered on order status — all of it fires off the order object. No order means no notification, from any source, to anyone. There is no native "you usually get 8 orders an hour and you got 0" alert, because the platform only reports things that happened, and a thing that stops happening isn't an event to it.
Compare that to an outright outage: the site is down, the client's phone starts ringing, the agency finds out from a friend, from Twitter, from an uptime alert. It's unpleasant but it's fast. A dead checkout that keeps returning 200 produces none of that pressure. It can run quietly for a day, a weekend, sometimes longer — the first anyone hears about it is the client asking why last month's revenue looks strange, at which point the money is already gone and there's no way to get those customers back.
What this looks like in practice
The order-events feed doesn't stand alone — it lands on the same per-site timeline as uptime incidents and deploy/update events, so when the anomaly fires you're not staring at a bare "0 orders" line with no context. You can see, on one timeline: orders arriving normally, then a plugin update, then the silence, then the incident 60 minutes in. The correlation between "what changed" and "what broke" is right there without cross-referencing three different tools. (More on that pairing in how a unified timeline puts the cause next to the effect.)
And this sits alongside the checks covered in reading failed-order spikes, stalls and silence and the daily checkout smoke test — together they cover the gateway-in-test-mode case, the broken-template case, and the "orders simply stopped" case from three different angles, rather than relying on any one signal to catch everything.
Check a WordPress site in one click
Availability from several locations in Europe and the US, SSL, domain expiry and WordPress health — free, no sign-up.
Check a siteThe uncomfortable summary
A green uptime dashboard tells you the server is fine. It has never told you, and structurally cannot tell you, whether anyone bought anything. The failure modes that leave a store selling nothing while returning 200 OK are common, not exotic — a test-mode gateway toggle, a template that shifted six pixels after an update, a webhook that stopped without an error. None of them show up as downtime. All of them show up as orders that should have happened and didn't.
This is not a request for more dashboards to check. It's the case for watching a different signal — the one the business actually cares about — with a baseline that knows what normal looks like for this specific store, at this specific hour.
Frequently asked questions
How can a store be broken if uptime monitoring shows 100%?
Because uptime checks answer "did the server respond," not "did the business work." A gateway left in test mode, a checkout template broken by an update, or a webhook that silently stopped firing all leave the HTTP response untouched — the page keeps returning 200 while nothing behind it functions.
What is an hourly baseline, and how many weeks of data does it need?
The store's own order volume, bucketed by day of week and hour, learned from eight weeks of its own history — so a Tuesday afternoon is judged against other Tuesday afternoons, not a flat average that would misfire on every quiet Monday.
Why does the detector wait 60 minutes before raising an incident?
To rule out ordinary variance. The alert only fires once the silence has held long enough to be a real signal against that store's own baseline — and only for hours where the baseline expects at least 3 orders, so slow stores don't get paged on a normal quiet hour.
Does this replace uptime monitoring?
No. Uptime, SSL, domain and checkout-page checks catch failures that change the HTTP response. Order-based anomaly detection catches the failures that don't. Each is blind to what the other is built to see, so you want both.
Get told when the orders stop — not just when the site does
Pingvera watches WooCommerce from inside: real-time order events, an hourly baseline built from your store's own history, and an incident when the site is up but nobody's buying. Free for up to 5 sites.
Start freeRead next: WooCommerce failed orders: what a spike, a stall and a silence each mean · The unified timeline: the deploy that broke checkout, next to the… · Marketplace and Store Reconciliation · Website looks fine but leads stopped coming · Check availability from several regions.