
The unified timeline: the deploy that broke checkout, next to the orders that stopped
The client's message is always some version of the same sentence: "orders stopped coming in, any idea why?" And the honest first move, every single time, is not to open the error log — it's to ask "what changed?" Nine incidents out of ten trace back to something that changed shortly before. The problem is that "what changed" usually lives in three different places: a deploy log, a plugin changelog nobody's watching, and your own memory of what you pushed on Tuesday. A unified timeline exists to collapse those three places into one line, so the cause is sitting right next to the effect instead of scattered across tabs you have to remember to open.
The debugging tax nobody puts on the invoice
Picture the ordinary version of this incident without a timeline. A client emails that orders have gone quiet. You open the uptime dashboard — green. You open WooCommerce — no obvious errors on the order list, because there's nothing to see, there just aren't any orders. You check the payment gateway settings — look fine at a glance. Then you remember, or a colleague remembers, or you go digging through a deploy log in a different tool: right, the WooCommerce plugin got updated Tuesday afternoon. That's forty-five minutes of cross-referencing to arrive at a fact that was true the entire time and simply wasn't visible from where you were looking.
That forty-five minutes is the debugging tax. It's not caused by the incident being hard — updating a plugin and breaking checkout is a common, almost boring failure mode. It's caused by the evidence for "what changed" and the evidence for "what broke" living in systems that don't talk to each other.
What "unified" actually means here
Pingvera's per-site timeline puts three kinds of signal on one shared clock:
- Business events —
order.createdandorder.failed, reported in real time by the WordPress/WooCommerce connector as checkouts complete, with the order id, amount, currency and status. - Deploys and updates — plugin, theme and core updates the connector observes on the site.
- Incidents — uptime, SSL, domain, checkout monitoring and the order-drought anomaly detector, all reported by monitoring from outside the site.
None of that requires you to do anything differently — the connector reports what happens on the site, the monitors report what they observe from outside, and both land in the same place with the same clock. The value isn't in any one of those three streams; it's that they sit next to each other in the order they actually occurred.
A concrete sequence, on the timeline
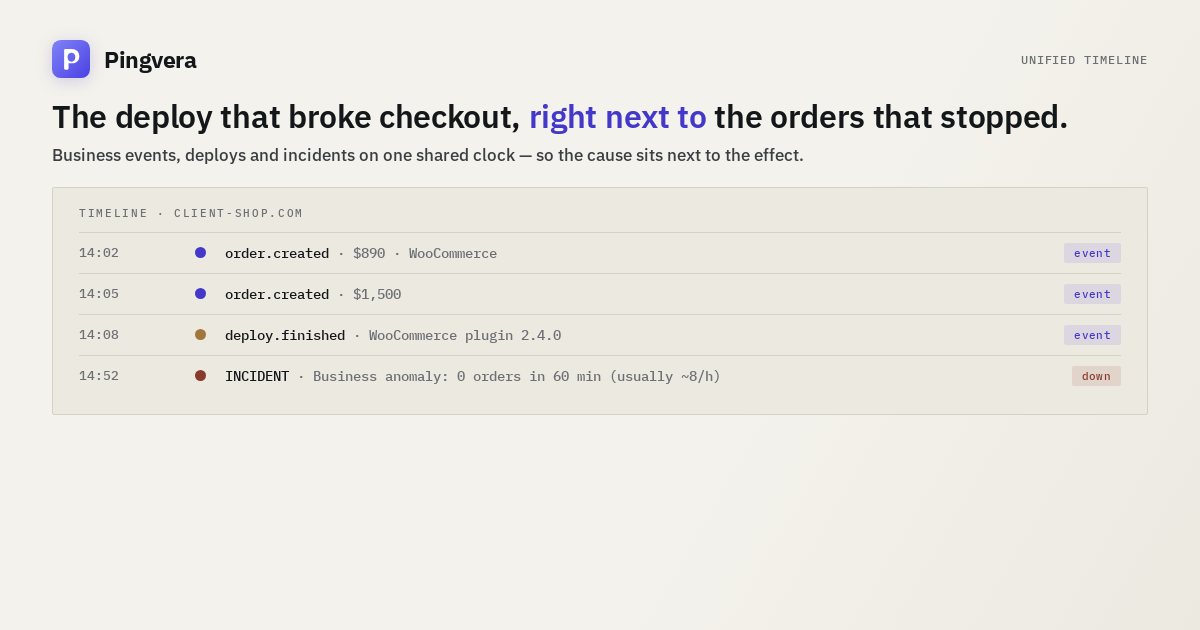
Here's the shape of an actual afternoon, as it would appear on a site's timeline — not a hypothetical, this is the exact pattern that ends up in a client's inbox as "orders stopped, any idea why?":
Reading that top to bottom takes ten seconds, not forty-five minutes. Orders were flowing normally. A plugin update landed at 14:08. The order stream went silent starting at exactly that point. The anomaly detector confirmed it as a real incident 60 minutes later — the debounce window described in how the hourly baseline and 60-minute silence threshold work. Nobody had to remember the deploy happened. Nobody had to open a second tab to check when it happened. It's the line right above the incident.
To be precise about what this is and isn't: the timeline doesn't run a root-cause algorithm or declare "the 2.4.0 update caused this." It puts the two facts next to each other, in the order they happened, and lets the person reading it draw the obvious conclusion — which in this case takes about one glance.
Debugging with vs. without a shared timeline
| Without a unified timeline | With a unified timeline | |
|---|---|---|
| Where "what changed" lives | Deploy tool, changelog, memory — three places, none of them timestamped against the incident | One line on the same timeline as the incident |
| Where "what broke" lives | Uptime dashboard, order list, gateway settings — checked one at a time | Same timeline, same clock |
| Time to correlate cause and effect | Cross-referencing timestamps across tools by hand | Read top to bottom |
| What you need to remember | That a deploy happened, and roughly when | Nothing — it's already on the line above the incident |
| Scales to 30 client sites? | Only if you personally remember every deploy on every site | Yes — per-site, automatic |
Why this matters more once you're past one site
On a single site you manage yourself, "what changed" is mostly a memory exercise — you probably remember pushing an update on Tuesday. That falls apart fast once an agency is running a portfolio: thirty client sites, updates going out on different schedules, some of them handled by different team members, some plugins auto-updating on their own. Nobody holds "what changed on which site, and when" in their head across thirty sites. The timeline is where that gets held instead — automatically, per site, without anyone having to keep a change log by hand.
It also changes the shape of the client conversation. "We think the update on Tuesday caused it, we're checking" is a much better message to send at minute five than "we're investigating" is at minute forty-five — and it's true because the timeline made it obvious, not because someone got lucky remembering the right thing.
Check a WordPress site in one click
Availability from several locations in Europe and the US, SSL, domain expiry and WordPress health — free, no sign-up.
Check a siteWhat this is not
Worth being precise here, because it's easy to over-promise on anything that touches the word "incident." The timeline observes and lays out — it does not act. Pingvera's agent is strictly one-way: it reports what it sees on the client's site and never receives commands, never deploys anything, never modifies anything on the client's machine. Nothing about the timeline changes that. It's a record you read, not a system that takes action on your behalf — the same principle that governs why the monitoring agent can't be told what to do.
The uncomfortable summary
Most client incidents aren't mysterious once you know what changed. The actual cost is almost always the time spent finding that out — hopping between a deploy log, an order list and an uptime dashboard that don't share a clock. Putting business events, deploys and incidents on one per-site timeline doesn't make incidents rarer. It makes the obvious explanation obvious immediately, instead of forty-five minutes later.
Frequently asked questions
What events actually appear on the unified timeline?
Business events from the WordPress/WooCommerce connector (order.created, order.failed, with amount, currency and status), deploy/update events, and monitoring incidents (uptime, SSL, domain, checkout, order-anomaly). All on the same shared clock, in the order they happened.
Is this an APM tool or a deployment tracker?
No. It doesn't instrument code or manage deploys — the connector reports updates and orders from inside the site, monitoring reports incidents from outside, and the timeline lays both on one shared clock for a person to read.
Does the timeline try to prove what caused an incident?
No. It lays out what happened, in order, and leaves the reading to the person looking at it. Pingvera observes and explains — it doesn't act on a client's site.
Why does this matter more for agencies than for a single site owner?
Because context is the first thing lost at scale. One person can usually remember what they changed on one site last week. Nobody remembers what changed on which of thirty client sites — the timeline holds that instead, automatically, per site.
See the cause next to the effect
Pingvera puts business events, deploys and incidents on one per-site timeline — so when something breaks, what changed is already on the line above it. Free for up to 5 sites.
Start freeRead next: Uptime green, orders zero: catching a WooCommerce store that stopped… · Ecommerce Checkout Friction Audit · Website looks fine but leads stopped coming · WooCommerce failed orders: what a spike, a stall and a silence each mean · Run a free site check.