
How to Monitor 50 Client Websites Without Alert Fatigue
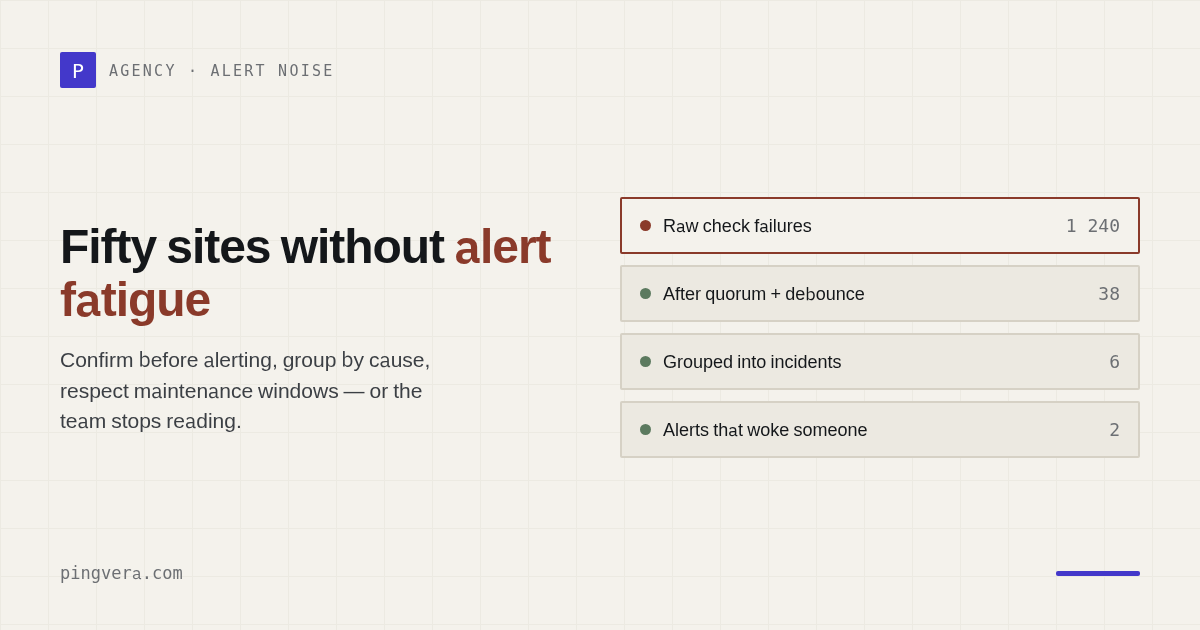
One website sends an occasional noisy alert. Fifty websites create a culture problem.
If the agency channel fills with brief network failures, repeated notifications, maintenance noise, and alerts nobody owns, the team learns the wrong habit: ignore monitoring until a client complains.
The fix is not fewer checks. It is better alert design.
Alert on user pain, not every internal wobble
Prometheus alerting guidance recommends alerting on symptoms associated with end-user pain and avoiding pages where there is nothing to do.
For a client website, actionable symptoms include:
- the website is unavailable from multiple regions;
- form delivery or another business-critical path fails;
- critical latency remains above the agreed threshold;
- the domain or SSL certificate enters a warning window;
- visitors are redirected to an unexpected host;
- a critical page becomes
noindex; - the server is approaching resource exhaustion.
A single packet loss event or one slow request may be diagnostic data, not a reason to wake someone.
Confirm before you page
Use confirmation rules:
- several consecutive failures;
- confirmation from a second region;
- retry with a fresh connection;
- content validation after a successful status code;
- a short
forduration before firing.
Prometheus supports a for clause specifically to require a condition to remain active
before an alert fires.
The confirmation window should reflect the risk. A failed payment path deserves faster escalation than a slow archive page.
Model dependencies
When a shared hosting provider, DNS service, or client server fails, dozens of child checks may fail at once.
Without dependency suppression:
- one incident becomes 200 notifications;
- responders investigate the same cause repeatedly;
- the real incident is buried.
Represent relationships:
client server
├── website
├── form endpoint
├── WordPress connector
└── status-dependent checks
When the parent is confirmed down, suppress or group child alerts while keeping their evidence.
Use maintenance windows
Planned updates should not create production incidents.
A maintenance window should:
- have a start and end;
- identify affected sites and checks;
- suppress notifications, not erase data;
- close automatically;
- alert if the service remains unhealthy afterward.
An open-ended "pause alerts" switch is how monitoring disappears for three months.
Route by responsibility
Not every alert belongs in the same channel.
| Severity | Example | Route |
|---|---|---|
| Critical | Site down, form failure, malicious redirect | On-call + incident channel |
| Warning | SSL in 14 days, disk at 85%, repeated latency | Assigned operations queue |
| Information | Certificate renewed, maintenance complete | Dashboard/report |
Add the client, site, check, owner, runbook, and evidence to each alert.
Deduplicate and group
One incident should have one lifecycle:
- opened;
- acknowledged;
- updated;
- resolved.
Do not send a new "site down" message every minute. Update the existing incident and send meaningful state changes.
Group:
- the same check across regions;
- dependent failures;
- repeated flapping;
- one underlying certificate or domain issue;
- site-wide link failures caused by one template.
Make every page actionable
Before enabling a critical alert, ask:
- Who receives it?
- What customer impact does it represent?
- What should the responder check first?
- Is there a safe action?
- What evidence is attached?
- When should it escalate?
- When does it resolve?
If nobody can answer, the condition belongs in a dashboard until the response is designed.
Monitor the portfolio without training your team to ignore it
Pingvera confirms failures, checks from multiple regions, suppresses dependency noise and maintenance, and routes alerts to Telegram, Slack, Discord, email, or webhooks.
Start free — up to 5 sitesA rollout plan for 50 sites
Week 1: critical outcomes
Enable availability, form-delivery, domain, and SSL checks for the ten most valuable sites.
Week 2: tune
Review every notification. Remove non-actionable pages, adjust confirmation, and assign owners.
Week 3: dependencies and maintenance
Map shared servers and providers. Standardize maintenance windows.
Week 4: scale
Apply templates to the remaining portfolio. Keep client-specific thresholds for business-critical sites.
Monthly
Review:
- alerts per site;
- false-positive rate;
- unacknowledged alerts;
- mean detection and resolution time;
- flapping checks;
- checks with no owner;
- monitoring coverage.
Frequently asked questions
How many alerts should an agency receive?
There is no universal number. Every critical notification should represent user impact or imminent risk and require a defined action.
Should warnings go to the on-call channel?
Usually not. Route certificate expiry, capacity trends, and non-urgent maintenance risks into an owned queue with deadlines.
What if a site flaps?
Use confirmation, hysteresis, and incident grouping. Then investigate the underlying instability rather than accepting permanent noise.
Sources
- Prometheus alerting practices
- Prometheus alerting rules and the for duration
- Atlassian: aggregate alerts and keep them actionable
Read next: How Web Agencies Monitor Client Sites on a Retainer · How to Manage Multiple Client Websites · Malicious Redirect Monitoring for Client Websites · Marketing Attribution Without Self-Deception · Run a free site check.