
Ecommerce Conversion Rate Drop: A 60-Minute Diagnostic Playbook
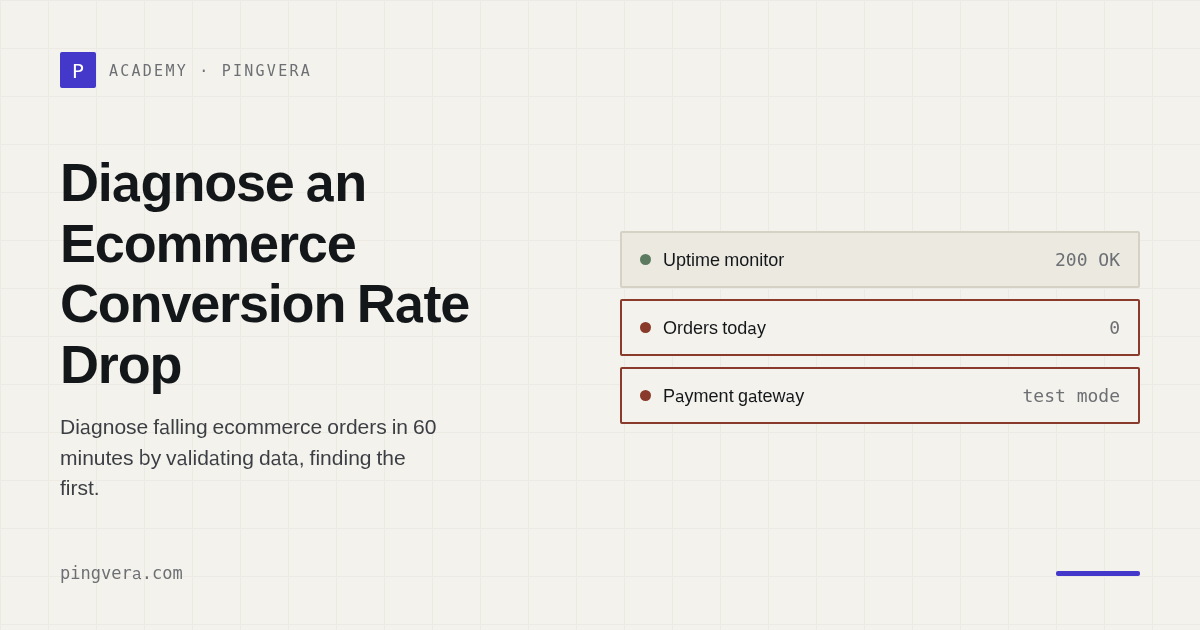
When ecommerce orders fall, first confirm the decline and identify the earliest funnel transition that changed. Work in order: data quality, demand, product discovery, cart, checkout, payment, order creation, OMS ingestion, and fulfilment.
The first hour is for narrowing the cause, limiting loss, and assigning owners. It is not the time to launch a redesign, replace the platform, or blame a vendor without evidence.
The first 60 minutes
- 0–10 minutes: validate the signal using two independent sources.
- 10–20 minutes: locate the first abnormal funnel step.
- 20–35 minutes: segment by device, region, channel, and payment method.
- 35–45 minutes: inspect recent changes and external dependencies.
- 45–60 minutes: enable a safe workaround, limit harmful traffic, and communicate facts.
Step 1: check whether sales or measurement failed
Compare at least two of:
- storefront or OMS orders;
- provider payment attempts and successes;
- CRM leads;
- analytics funnel events;
- delivery emails or help-desk records;
- server and application logs.
Orders present in the OMS but absent from analytics indicate a measurement problem. Successful payments without orders are a high-risk reconciliation incident. No payment attempts usually means the break is higher in the journey.
Step 2: find the first changed transition
| Stage | Observation | Likely area |
|---|---|---|
| Qualified sessions | Relevant traffic declined | Campaign, search, link, regional access |
| Product views | Traffic stable; discovery weaker | Search, navigation, catalogue, performance |
| Add to cart | Views stable; cart actions fall | Price, inventory, button, JavaScript, mobile UX |
| Begin checkout | Carts stable; fewer starts | Shipping surprise, account requirement, routing |
| Order creation | Starts stable; orders fall | Validation, promotions, backend, tax or shipping API |
| Payment success | Orders stable; payments fall | Method, authentication, provider, webhook |
| Fulfilment | Payments stable; shipments fall | OMS, inventory, 3PL, integration |
Downstream metrics often fall because of the first broken transition. Start there.
Step 3: segment the impact
Check:
- mobile vs desktop;
- operating system and major browser;
- region, currency, and language;
- new vs returning customer;
- paid, organic, affiliate, and direct traffic;
- guest vs account checkout;
- promotion vs standard pricing;
- payment and shipping method;
- product category;
- experiment variant or storefront version.
“Safari checkout after release 4.8” is actionable. “Conversion is down 12%” is not.
Step 4: build a timeline
Include:
- storefront and app releases;
- tag-manager and consent changes;
- CMS, plugin, or theme updates;
- promotion and pricing rules;
- carrier and shipping configuration;
- product feed and inventory updates;
- DNS, CDN, and certificate changes;
- payment configuration;
- campaigns and landing pages.
Time correlation is not proof, but it creates a shortlist of reversible, testable hypotheses.
Rapid hypothesis matrix
| Hypothesis | Fast check | Safe action |
|---|---|---|
| Mobile checkout regression | Real-device synthetic order | Roll back or disable feature flag |
| Promotion rule fails | Basket with and without offer | Disable affected rule |
| One payment method fails | Sandbox test plus provider status | Offer a known-good alternative |
| Order creation fails | Server logs and marked test | Safe intake fallback or pause |
| Inventory is stale | Reconcile control SKUs | Hide uncertain products |
| Webhook is delayed | Compare provider and order state | Reconcile through documented API |
| Analytics is broken | Browser events vs OMS orders | Label reporting issue; fix tracking |
| Traffic quality changed | Segment acquisition sources | Adjust campaign, not checkout |
Decide what to do with paid traffic
- If the purchase path is confirmed broken for everyone, pause traffic to it.
- If one segment is affected, limit only the relevant devices, regions, or campaigns.
- If a safe alternate route exists, change the destination and message.
- If traffic quality is the cause, correct acquisition while healthy orders continue.
- Record pause and restart times for the later analysis.
Avoid an automatic all-channel kill switch tied to one noisy metric.
Copyable hypothesis log
| UTC time | Observation | Hypothesis | Test | Result | Owner |
|---|---|---|---|---|---|
| Order decline confirmed | |||||
| First changed transition | |||||
| Affected segment | |||||
| Recent change | |||||
| Workaround |
This prevents duplicate work and preserves evidence for the incident review.
After recovery
- Confirm the journey with several marked tests.
- Observe the funnel for an agreed window.
- Reconcile payments and orders during the affected period.
- Recover stuck operations safely.
- Estimate business impact as a range.
- Add a regression or journey check where safe.
- Document root cause and systemic action.
Common mistakes
- looking only at blended conversion;
- trusting one analytics platform;
- checking only the homepage;
- changing several systems at once;
- blindly retrying payment or order creation;
- stopping all acquisition for a localised problem;
- declaring recovery after one successful test;
- skipping payment and order reconciliation.
FAQ
When is a conversion drop an incident?
When it is confirmed, materially affects a critical journey, and requires urgent coordinated action. Build the threshold from your baseline, volume, and contribution at risk.
How can I distinguish seasonality from a technical failure?
Compare genuinely similar periods and inspect funnel transitions. Demand changes often begin at the top; a technical regression commonly creates a sharp break at one step or segment.
Can synthetic tests place orders?
Yes, if they are clearly marked, financially safe, isolated from inventory and reporting, and cleaned up through an approved process.
Sources and further reading
- Google Analytics: measure ecommerce events
- Google Analytics: funnel reporting
- Google SRE: Monitoring Distributed Systems
Reviewed: 10 August 2026.
Next: payment-to-order reconciliation, critical journey monitoring, and the incident response playbook.
Pingvera can run revenue-journey checks continuously so a technical funnel break is visible before it appears only in daily sales reporting.
Know about problems before your customers do
Pingvera watches whether an online business actually works — uptime, checkout, orders, domain, SSL and server — and alerts you in Telegram, email or a webhook before a customer has to tell you.
Start freeRead next: Fraud Controls vs Ecommerce Conversion · Ecommerce Automation ROI Framework · Ecommerce CRO Operating System · Ecommerce Replatforming Checklist · Run a free site check.